
Learning Objectives
After completing the lesson you will be able to:
1) Define root cause analysis (RCA)
2) Demonstrate RCA using a Fishbone Diagram
Case Study: “Why don’t we get paged sooner?”
At an HCI Clinic, providers are often delayed in how soon they see a patient during a new visit appointment. Typical delays (wait time) from check-in to provider page was 20 minutes. This 20-minute delay presented a cascade of problems for patients and care teams. For patients, it limited face-to-face time with a provider. For residents, the lack of time hindered care - building rapport with patients, potentially missing important details that help inform the care plan. The delay also caused resident job dissatisfaction. To identify all the moving parts in this complex (yet seemingly simple) problem, the team turned to the fishbone diagram as a useful tool to investigate the multiple causes of delay.
Health care’s problem solving toolkit
health care, we rely on evidence-based methods for solving problems. Root Cause Analysis (RCA) is a collective term that describes a wide range of approaches used to investigate a problem and its causes.
When we talk about a problem we often refer to its impact. We know how it impacts us personally, our system, patients, and/or customers. But our experience of the problem—it’s impact—doesn’t really tell us why it’s happening—the cause. If we don’t know the cause, we won’t be able to prevent it from happening again. Investigating a problem and its causes can result in long-term solutions, which is an essential part of our patient safety journey.
Fishbone Diagram
Quick Tips
Download the Fishbone Diagram Quick Tips here.
Download a U of U Health PowerPoint Fishbone Diagram template here.
An easy to use tool for conducting a root cause analysis
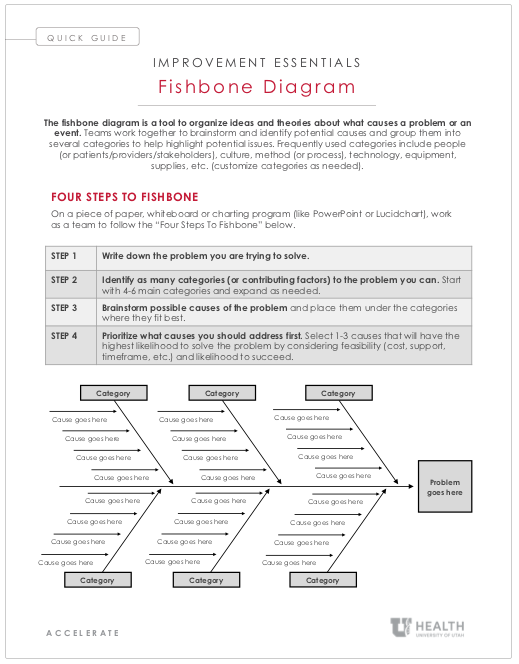
What it is: The fishbone diagramAlso referred to as “Ishikawa cause and effect” after Japanese founder and quality control expert Kaoru Ishikawa. is a tool to organize ideas and theories about what causes a problem or an event.
How it works: Teams work together to brainstorm and identify potential causes and group them into several categories to help highlight potential issues. Frequently used categories include people (or patients/providers/stakeholders), culture, method (or process), technology, equipment, supplies, etc. (customize categories as needed).
Follow Four Steps to Fishbone:
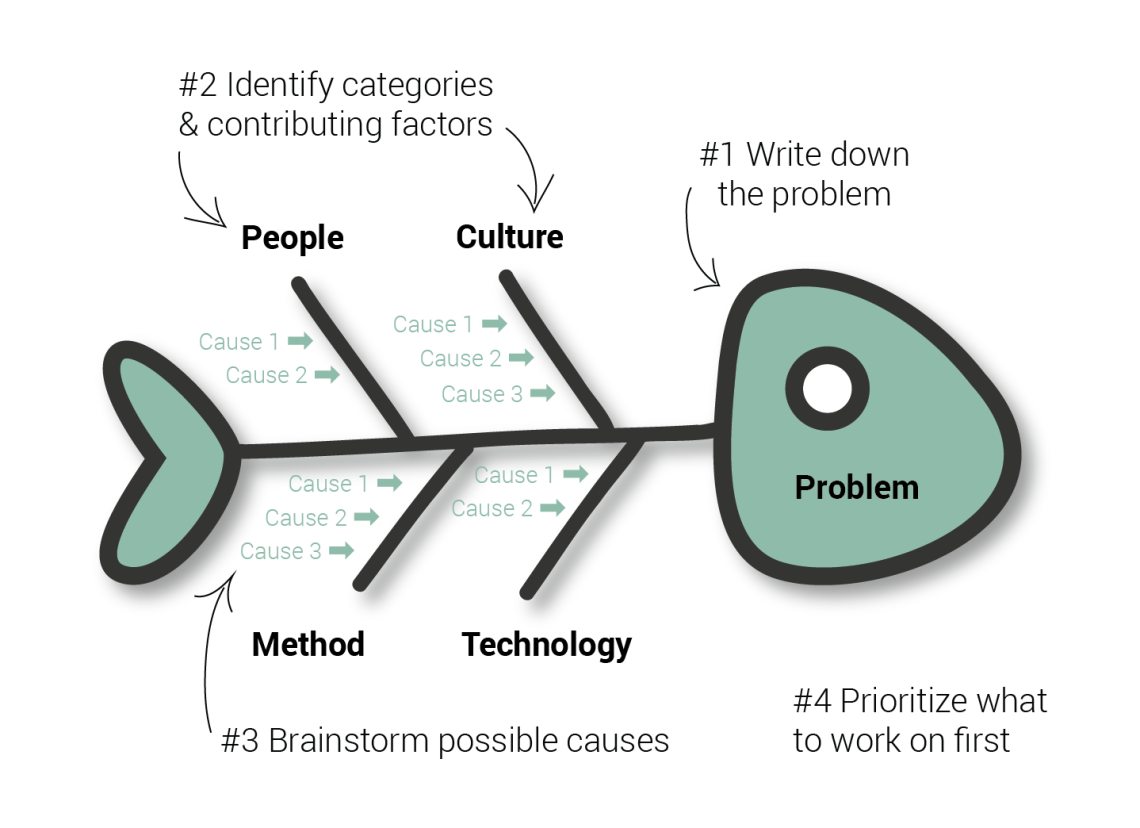
| Step 1: | Write down the problem you are trying to solve. |
| Step 2: | Identify as many categories (or contributing factors) to the problem you can. Start with 4-6 main categories and expand as needed. |
| Step 3: | Brainstorm possible causes of the problem and place them under the categories where they fit best. |
| Step 4: | Prioritize what causes you should address first. Select 1-3 causes that will have the highest likelihood to solve the problem by considering feasibility (cost, support, timeframe, etc.) and likelihood to succeed. |
Three Tips for facilitating a fishbone
A successful fishbone diagram is led by a facilitator—one individual on the team who’s job is to remain impartial to the discussion, write down the identified causes on the fishbone diagram, and let the participant discussion flow freely.
Here are the top three tips for leading a successful fishbone:
#1: Help the team focus on identifying causes, not solutions. It’s common for people to brainstorm solutions (how to fix), rather than causes (what to fix). Simply acknowledge any comments by writing them to the side (don’t disregard any comments, it’s demoralizing) and help everyone remember the difference between the two. For example, if the problem is delays at patient check-in, “add front desk personnel” offers a solution (how to fix). Whereas “front desk is short-staffed” focuses on a potential cause (what to fix).
#2: The cause is more important than the category. People often get confused or stuck on what category a cause should go into. As a facilitator, remind the participants that listing the cause is more important than where it goes. For example, “front desk is short-staffed” could be placed under the category of People, but also Culture.
Sometimes a main category can become too big. A common one is to start with the “People” category, but by the time 10 causes are identified under that category, you may choose to split it, for example as: “Nurses” and “Doctors.”
#3: Keep brainstorming until the ideas run out. People are often unsure of how many causes to identify. As long as the discussion keeps going, people are still brainstorming. When the silence starts to creep in, you have your first clue that perhaps you have enough to get started.
As facilitator, you will write the statements as they come out during the discussion. If you have to paraphrase what was said (because of space requirements, complexity, etc.) confirm with the group that what you wrote was what was said.
See it applied
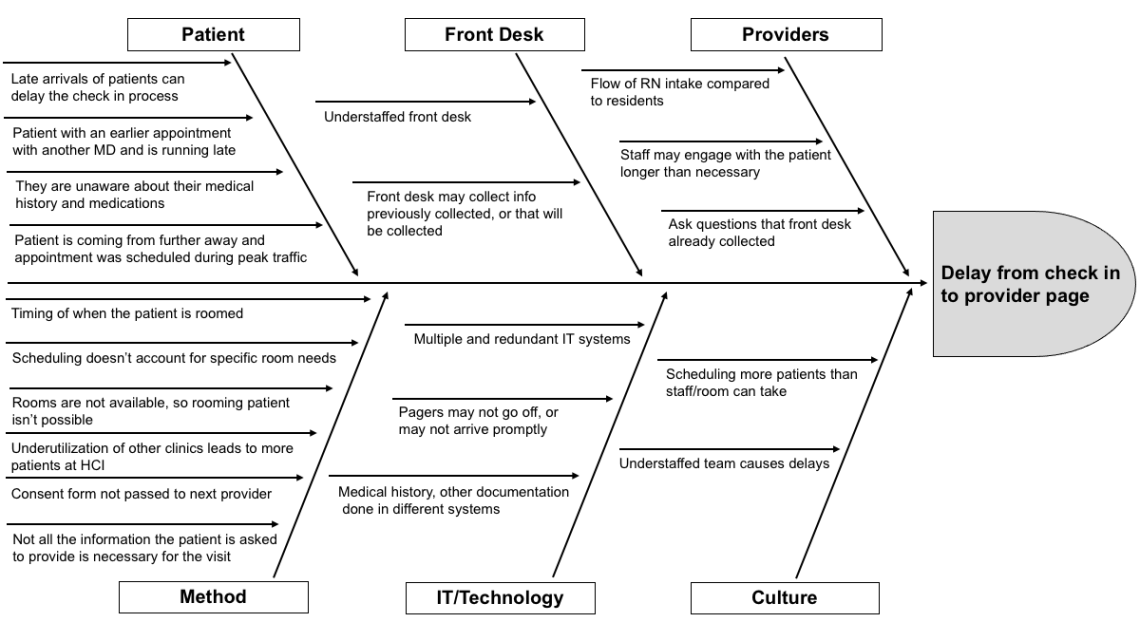
Returning to our introduction case study, the Oncology residents first mapped the process to identify where it was breaking down. They then brainstormed as a team and came up with the following categories and causes.
HCI Huntsman Clinic Check in to Provider Page Process Fishbone Diagram
Oncology team: Lindsay Burt, MD; Chris Baker, MD; Chris Weil, MD; Josh Gruhl, MD; Matthew arsons, MD; Ryan Hutten, MD; Ryan Kraus, MD; Timothy Griffith MD
Conclusion
Solving the age-old problems of health care doesn’t require more solutions. It requires better understanding of problems. The oncology residents found the fishbone a useful tool to illustrate how many variables contribute to a seemingly simple question: “why don’t we get paged sooner?” By breaking the problem into a series of categorized causes, the team identified overlap between workflows. Using this information, the team is now prioritizing causes from high-to-low effort to begin making improvements.
*Originally published Janurary 2021
Luca Boi
Finding evidence to change the status quo isn’t easy; thinking about evidence in terms of how it persuades—whether subjective or objective—can make it easier. Plastic surgery resident Dino Maglić and his colleagues followed their guts and saved money by improving the laceration trays used to treat patients in the emergency department.
Why do some organizations thrive during a crisis while others flounder? Iona Thraen, director of patient safety, joined forces with her ARUP Laboratory colleagues to learn how the world-renowned national reference lab adapted to the pandemic. Leaders created a culture of safety by putting innovation, learning, and patient-centered care at the heart of all their efforts.
The Zero Suicide initiative has been shown to significantly reduce suicides—and working toward zero suicides is our mission. Rachael Jasperson, Zero Suicide program manager, shares the framework for how we strive for this aspirational goal.